
Follow activity with structured logs
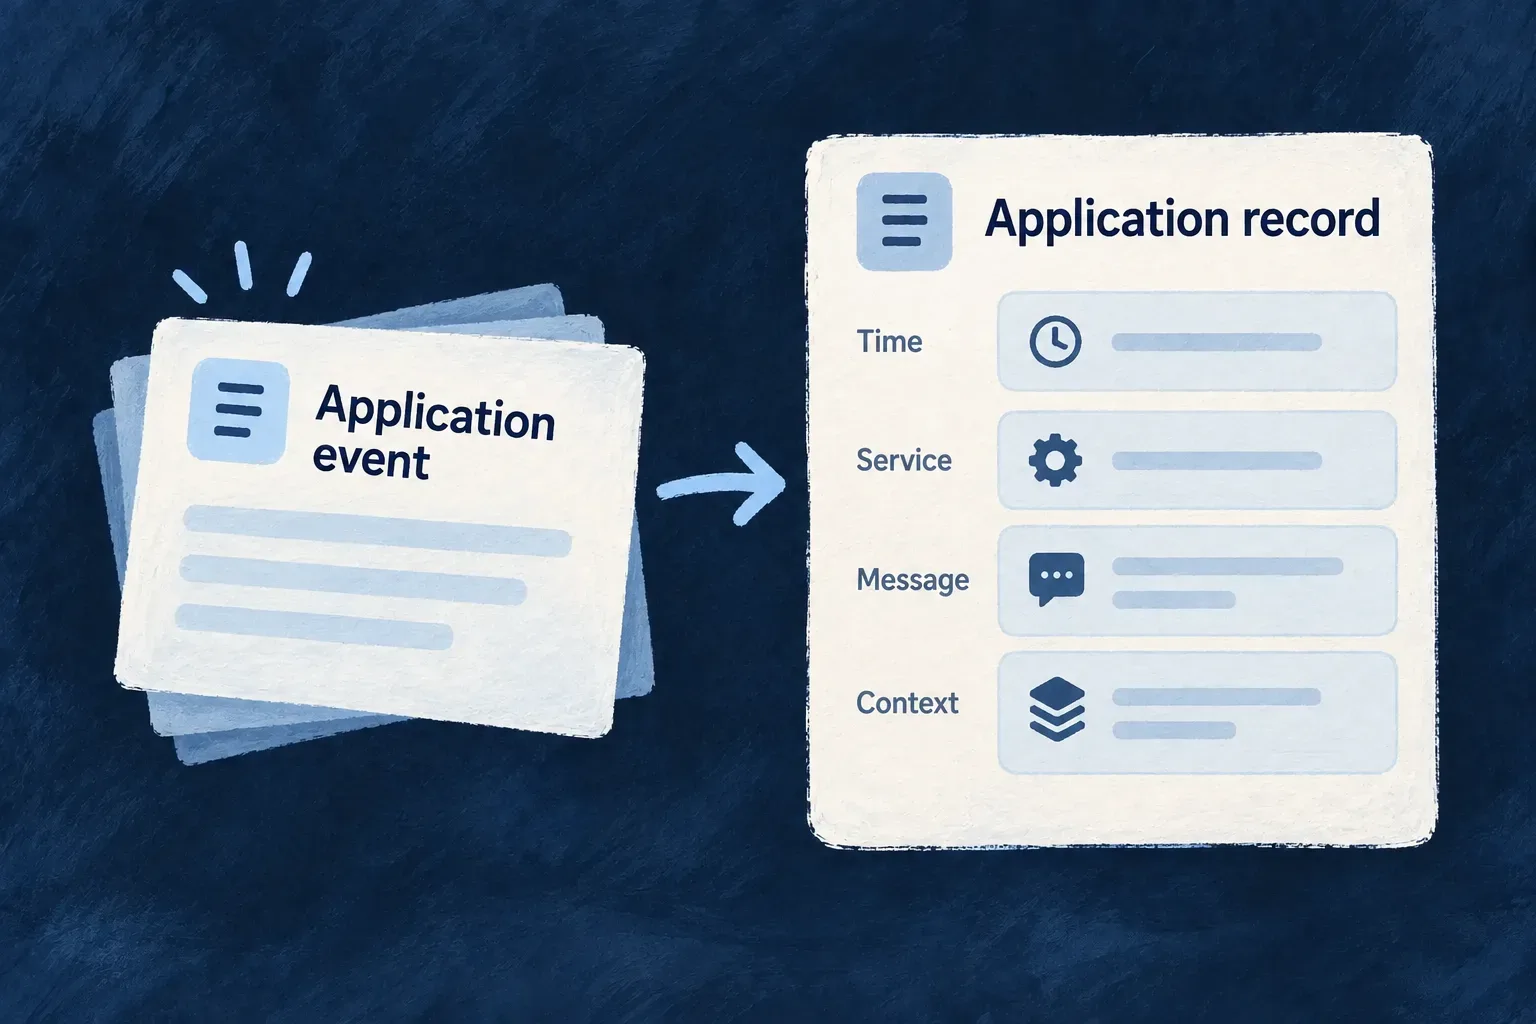
Application logs keep messages, service identity and diagnostic context as separate fields. Wildo adds the current request’s correlation ID when one is available, so related activity can be found together.
The same record can serve a developer reading a terminal and an operator filtering an observability tool. You choose which application events deserve a log and what information belongs in their context.
Example — Find the work behind a failed request
A support report includes a correlation ID. Filtering backend logs by that ID brings together the request’s application messages and its handled error without searching for fragments of a person’s name.
For engineers
Write fields that can be queried
Use the injected LoggerService in a backend service. Supply an object as context; do not stringify it before logging. This illustrative service-body excerpt assumes logger is the injected logger and the surrounding application owns the operation:
logger.info('Document generation started', {
  documentId,
  templateRef,
  format: 'pdf',
});

// The operation's result is already available here.
logger.info('Document generation completed', {
  documentId,
  durationMs,
  outputBytes,
});
The message describes an event; the fields make two runs comparable. These are application-selected diagnostic fields, not an instruction to log complete records, credentials or document contents. Logger redaction covers configured paths; it cannot discover every sensitive value inside arbitrary application data.
Understand what the logger adds
LoggerService.createLogger() reads request context at emission time. This source excerpt is the correlation portion of its Pino configuration:
mixin: () => {
  const frame = getRequestContextFrame();
  if (!frame) {
    return {};
  }
  return {
    correlationId: frame.correlationId,
    ...(frame.frontendServiceName ? { frontendServiceName: frame.frontendServiceName } : {}),
    ...(frame.clientInstanceId ? { clientInstanceId: frame.clientInstanceId } : {}),
  };
}
Service and environment identity are configured separately on every record. A startup log outside a request has no request frame; do not invent a correlation ID simply to fill a column. Wildo’s correlation ID is distinct from an OpenTelemetry trace ID, although instrumentation can connect the two.
Preserve useful error structure
For a handled, best-effort catch, use projectCaughtErrorLogFields(error) from @wildo-ai/saas-backend-lib in the context. It preserves classified Wildo errors, native error details and structured validation issues. The logger normalizes nested values rather than burying another JSON string inside JSON.
For a failure you propagate to an existing request boundary, let that boundary log it. Repeatedly logging and rethrowing creates several apparent incidents from one failure. See error severity and telemetry export for those separate steps.