
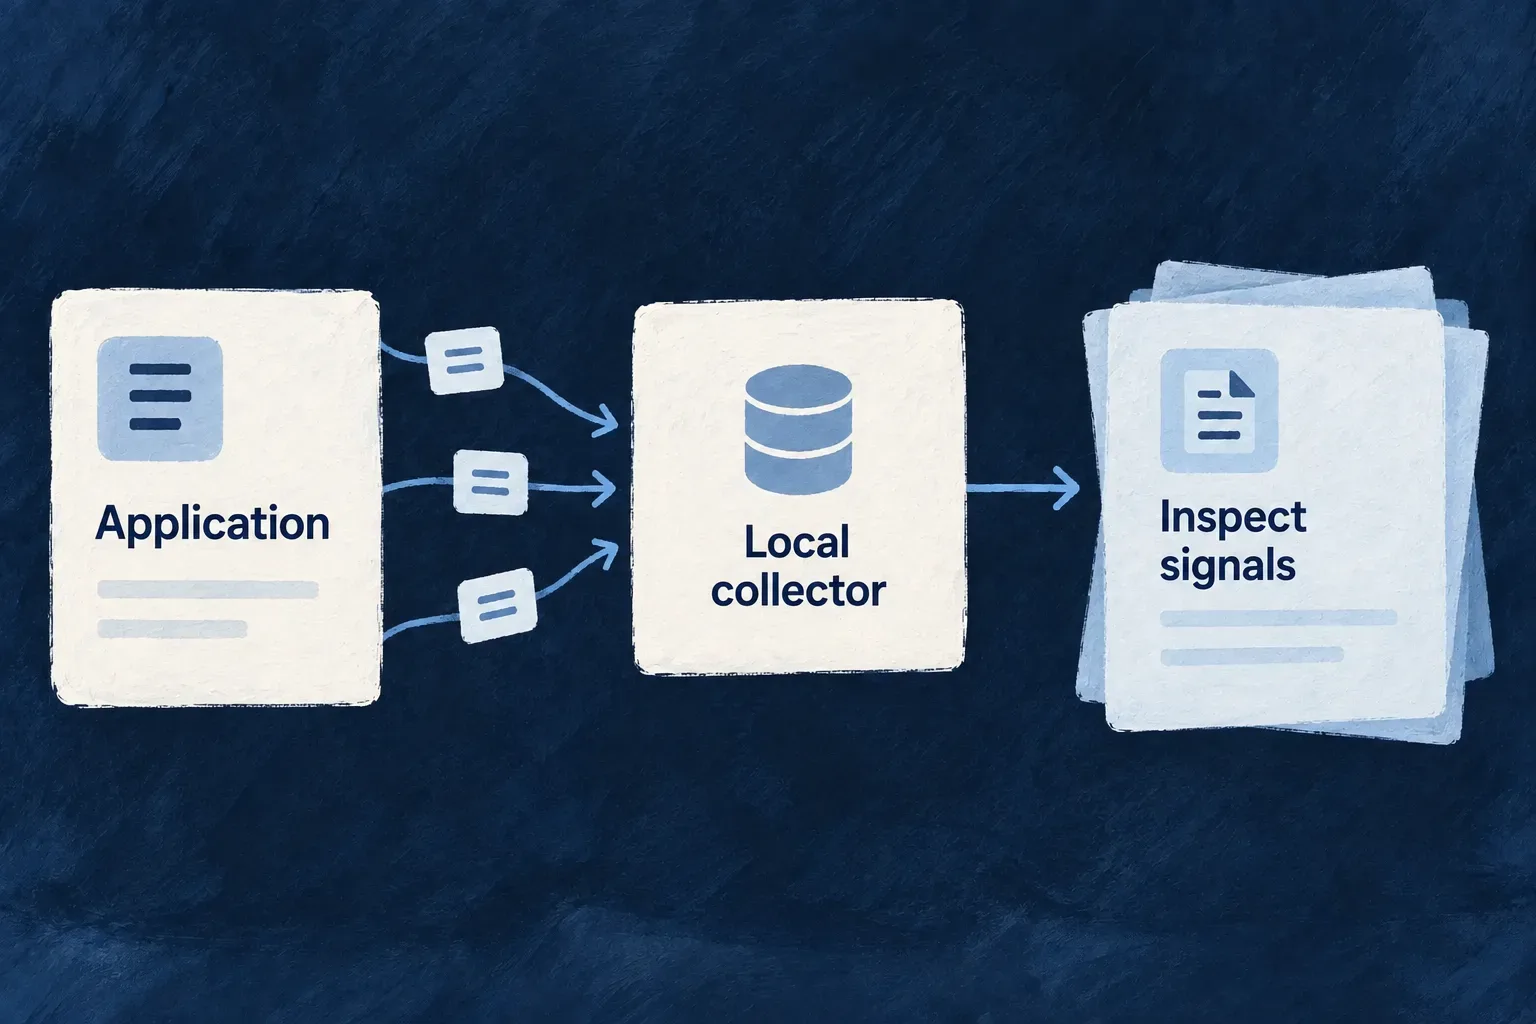
Inspect telemetry locally
A local OpenTelemetry collector gives development processes a nearby receiver for traces, metrics and logs. Wildo’s Compose generation includes it when telemetry is enabled and the configured endpoint points to localhost.
This lets a team inspect the telemetry path before connecting a remote receiver.
Example — Check that a backend emits signals
A developer enables a localhost endpoint, starts the generated stack and performs an application action. Collector output shows whether records arrived from that backend; a configured endpoint alone would not establish that.
For engineers
Make the collector an environment decision
The selected local environment block is:
observability: {
  enabled: true,
  endpoint: 'http://localhost:4318',
},
The Compose generator parses the endpoint and checks its hostname. localhost and 127.0.0.1 activate local collector inclusion; a remote destination does not silently add a redundant local collector. An explicit endpoint port determines the published host port, with the OTLP/HTTP default when omitted.
Follow the generated service
This selected Compose template excerpt shows the collector’s image, configuration and published-port relationship:
otel-collector:
  image: otel/opentelemetry-collector-contrib:0.154.0
  container_name: wildo-otel-collector
  restart: unless-stopped
  mem_limit: 512m
  configs:
    - source: wildo-otel-collector-config
      target: /etc/otelcol-contrib/config.yaml
  ports:
    - "{{otelCollectorHostPort}}:{{otelCollectorInternalPort}}"
The braces are generator substitutions, not values to paste into a completed Compose file. The template also joins the collector to the telemetry network with a dedicated internal alias. Host processes and containers therefore use addresses appropriate to their network context.
Inspect receiving independently of application configuration
After the existing local stack is running, a bounded read of its collector output can show received signals:
docker logs --tail 2000 wildo-otel-collector 2>&1
Include stderr: a debug exporter can write there. First confirm a known signal is visible, then look for the intended service and trace; an empty filtered stdout stream is not proof of missing telemetry. Increase the bounded window only when needed to reach the event you are investigating.
The receiver is not a searchable long-term store, a dashboard or an alerting policy. Those come from the destination you operate. Keep the selected environment, generated networking and application preload aligned rather than starting a competing collector on the same port.