
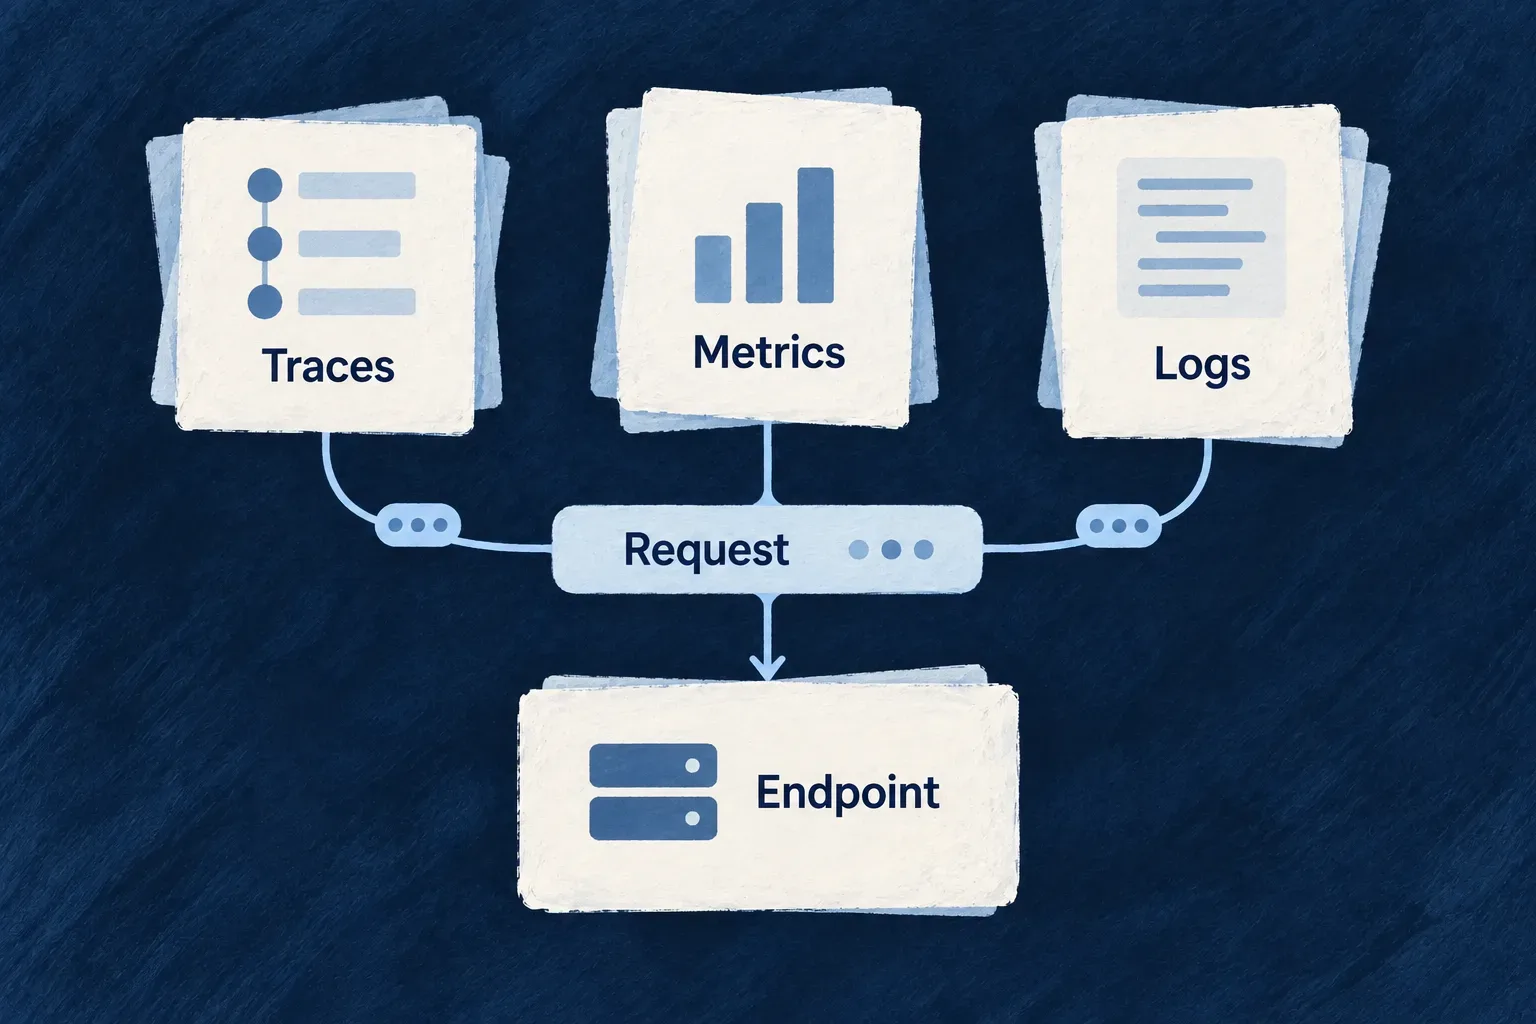
Connect traces, metrics and logs
Backend activity can produce connected traces, measurements and log records through OpenTelemetry. Wildo starts the instrumentation before application code and sends those signals to the configured OTLP endpoint.
This helps an operator move from a slow request to the calls and messages around it, while application code keeps a consistent logging interface.
Example — Explain where a request spent its time
A request feels slow. Its trace identifies time spent in instrumented dependencies, while related logs provide the application’s own context. The operator can investigate the relevant step rather than treating the whole request as one unexplained delay.
For engineers
Configure the runtime before it starts
In the environment configuration, author the endpoint the process can reach. This selected Wonder Todos local configuration sends to its local collector:
observability: {
  enabled: true,
  endpoint: 'http://localhost:4318',
},
Configuration synchronization projects this onto OTEL_ENABLED, OTEL_EXPORTER_OTLP_ENDPOINT, OTEL_SERVICE_NAME and resource attributes. Provider authentication is a separate scoped input. A container may need the generated internal service address rather than the host’s localhost address.
The runtime launcher must preload @wildo-ai/saas-backend-lib/otel-preload with Node’s --import before instrumented modules load. Setting an endpoint alone does not start the SDK. The preload reads its early environment and only activates when OTEL_ENABLED enables it.
See the three signal paths
This selected SDK configuration comes from otel-preload.ts; instrumentation options are omitted here:
const sdk = new NodeSDK({
  serviceName: process.env.OTEL_SERVICE_NAME ?? 'wildo-saas-backend',
  traceExporter: new OTLPTraceExporter(),
  metricReader: new PeriodicExportingMetricReader({ exporter: new OTLPMetricExporter() }),
  logRecordProcessors: [new BatchLogRecordProcessor(new OTLPLogExporter())],
  // Auto-instrumentation and the Pino bridge are configured here too.
});
Automatic instrumentation supplies dependency spans and measurements. Pino instrumentation adds a log export destination while retaining the original output stream. Filesystem and low-level network instrumentation are disabled in the preload to reduce noise. Framework counters cover additional specific operations; application-specific measurements require their own deliberate instrumentation.
Check activation, then delivery
ObservabilityBackendService compares selected telemetry intent with the SDK handle published by the preload. A mismatch produces a diagnostic rather than pretending collection is active. The service registers SDK shutdown with the existing shutdown coordinator, including a telemetry-enabled host without a queue; short-lived natural exits also have a preload backstop.
A loaded SDK is only the first check. Confirm that the intended collector receives the signals from the correct service. An unreachable endpoint, authentication failure or abrupt process kill can lose telemetry. Export is observation of application work, not durable business accounting or automatic incident repair.