
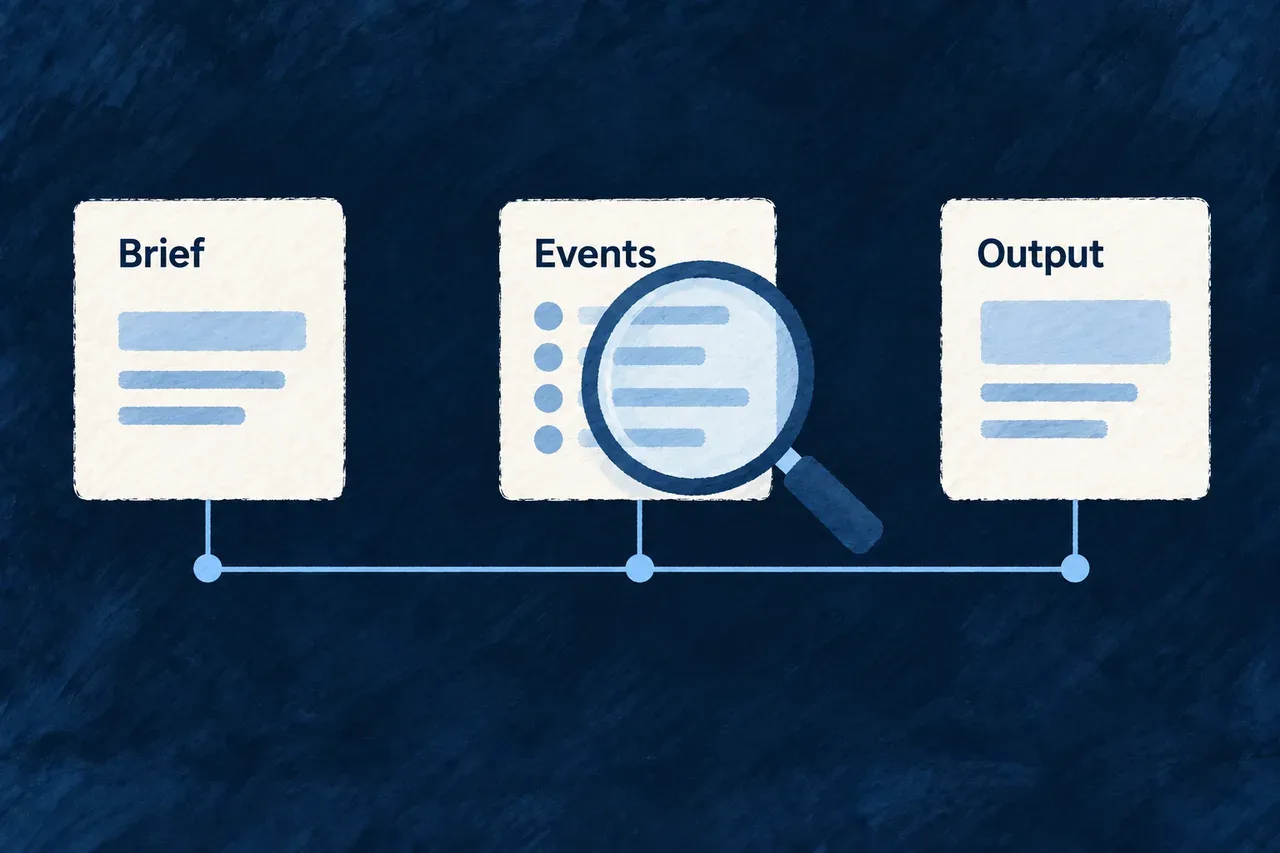
Understand what happened inside a creation step
When generated work surprises you, the output alone rarely explains why. You need to know what the step was asked, which context it received and what happened during the attempt.
Execution traces connect recorded events with larger artifacts such as input briefs and structured answers. They help you investigate a result without recreating the run from memory.
Example — Find the context behind an unexpected answer
A generated product definition omits an important constraint. The developer reads the recorded brief to check whether the constraint reached that attempt, then compares its answer and validation findings. Missing input and ignored input call for different corrections.
For engineers
See where tracing enters generation
This excerpt is from the generation loop in playbook-generation-run.application-creation.service.ts, with formatting expanded and commentary omitted. It shows an attempt’s event and saved brief; model invocation and validation follow it:
while (attempts < maximumAttempts) {
  attempts += 1;
  const prompt = attempts === 1
    ? output.brief
    : `${output.brief}\n\n# YOUR PREVIOUS ANSWER WAS REJECTED\n${rejectedFindings.at(-1) ?? ""}\n`
      + "Correct exactly those points. Everything else about the contract is unchanged.";

  await trace.event({
    type: PlaybookExecutionTraceEvent.GENERATION_REQUESTED,
    summary: `Ask the model for "${output.family}" (attempt ${attempts} of ${maximumAttempts})`,
    payload: {
      playbookRef: input.playbookRef,
      family: output.family,
      schemaRef: output.schemaRef,
      attempt: attempts,
    },
  });
  await trace.artifact({
    fileName: `${output.family}.attempt-${attempts}.brief.md`,
    content: prompt,
    format: PlaybookExecutionTraceArtifactFormat.TEXT,
  });
  // Model invocation and answer validation follow.
The retry brief includes the preceding rejection findings. The event’s family, schema and attempt identify the work being requested; the artifact stores the prompt that attempt receives. Those are related diagnostic records, not an extra acceptance state.
Read sessions and their artifacts
| Read interface | Information returned |
|---|---|
GET /api/companion/traces?limit=10 | A bounded list of recorded sessions |
GET /api/companion/traces/:sessionId | The selected session’s trace information |
GET /api/companion/traces/:sessionId/steps/:stepDirName/artifacts/:fileName | A selected step artifact as text |
The colon-prefixed segments are identifiers obtained from the preceding reads. The reader restricts their characters rather than accepting arbitrary filesystem paths. The session-list limit accepts integers from 1 to 200; omission uses its default.
Briefs are saved as Markdown; structured answers can be JSON. Do not assume every artifact is raw model prose, or parse the artifact route as a JSON response solely because its filename ends in .json.
Distinguish evidence of a run from correctness of its output
| Record | What it helps establish | Follow-up |
|---|---|---|
| Brief | What was recorded as input to the attempt | Check the intended facts and constraints reached it |
| Events and findings | Which stages and validation outcomes were recorded | Follow the associated attempt and result |
| Answer artifact | The recorded generated content | Compare it with the landed files and requirements |
| Application verification | Whether the relevant behavior worked | Exercise the real operation or test |
Tracing is optional and best effort. The default trace port discards events; companion integration supplies file-backed tracing for a request session. A missing trace does not prove that no work happened. A present trace is not an application audit log, a guarantee of successful publication or a replacement for verification.