
Turn records into useful measures
A useful chart starts with a question about the data: how work is distributed, how much remains or how activity changes over time. Wildo connects that query with its chart presentation.
Choose the dimensions, measures and visual form. The backend executes the declared aggregation in the caller’s context; the frontend turns the result into a chart.
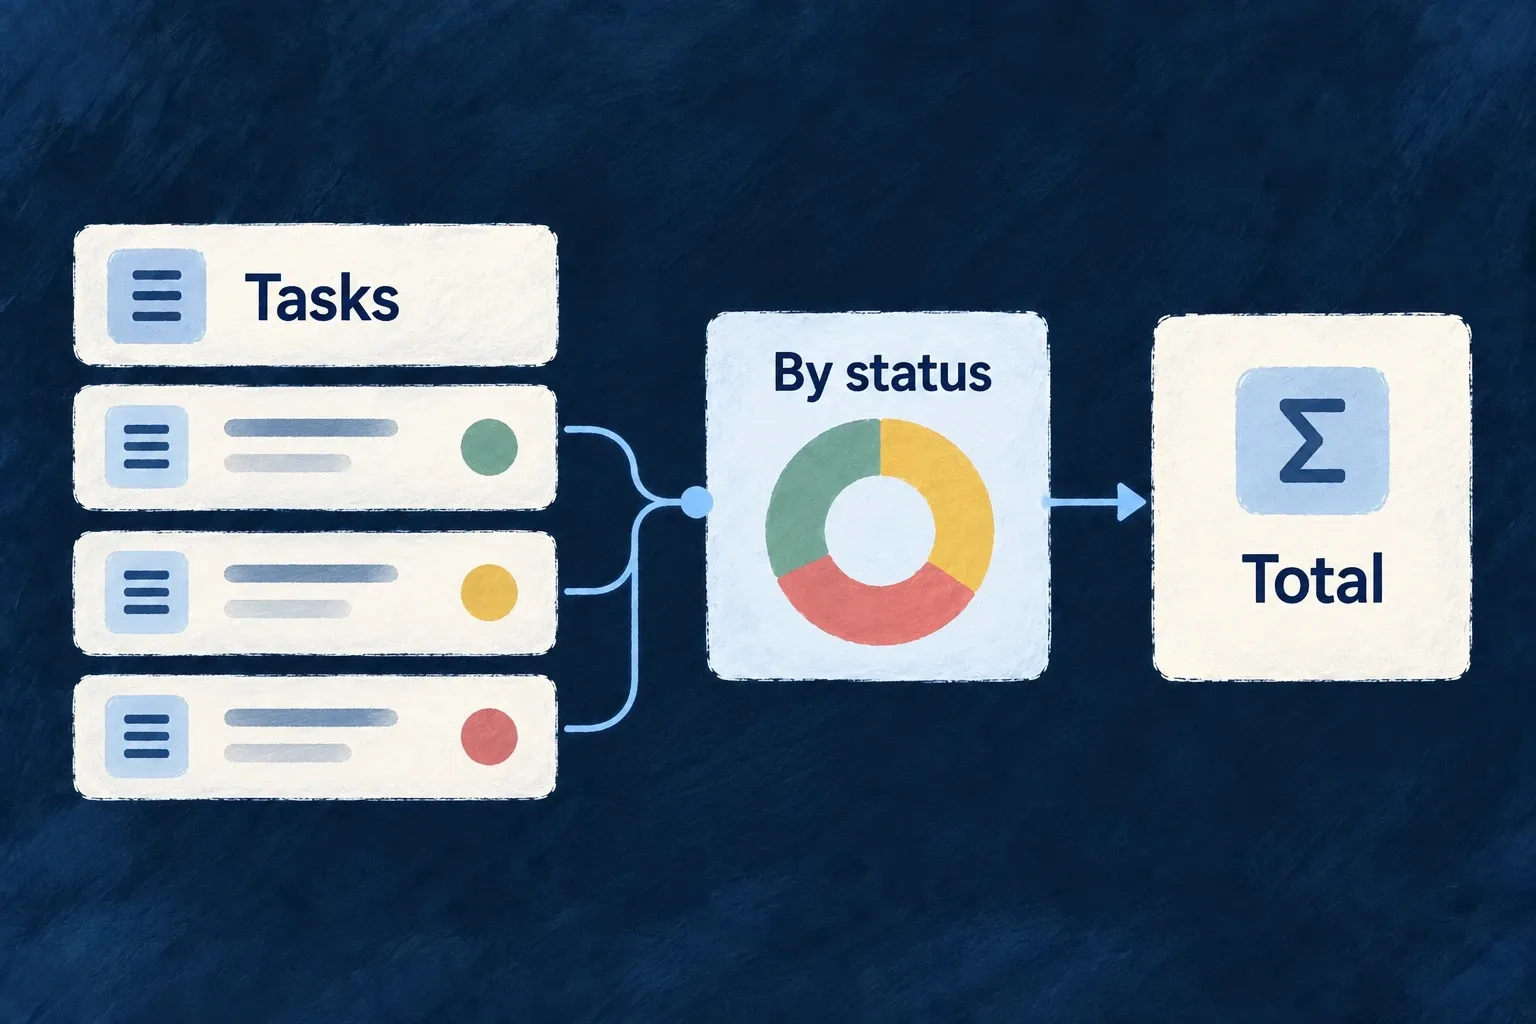
Example — See work by status
A task dashboard groups tasks by status and counts each group. A donut shows that distribution while the same result can supply summary figures.
For engineers
Share the chart definition across both layers
Wonder Todos declares this complete chart object in shared-lib. Imports are omitted; ChartDefinition, ChartType and AggregateFunction come from @wildo-ai/saas-models:
export const todosByStatusChartDefinition: ChartDefinition = {
  ref: 'wonder-todos-todos-by-status',
  chartType: ChartType.DONUT,
  dataQuery: {
    mainResourceType: TasksManager_ResourceType.TODOS,
    dimensions: [
      {
        ref: 'status',
        field: 'status',
      },
    ],
    measures: [
      {
        ref: 'count',
        field: '*',
        aggregate: AggregateFunction.COUNT,
      },
    ],
  },
  series: [
    {
      ref: 'todos-by-status',
      name: 'Todos by status',
      measureRef: 'count',
      splitByDimension: 'status',
    },
  ],
};
The dimension names the grouping field. The measure counts records, and the series selects that measure and splits it by the status dimension. This chart has no parent-record filter: it describes the current organisation’s todos, not the tasks beneath one particular todo.
Register execution and presentation
The backend module includes this shared object in chartDefinitions. The frontend resource behavior names the same object in chartViews:
{
  ref: todosByStatusChartDefinition.ref,
  scope: FrontendView_ScopeMode.RESOURCE,
  isAddressable: false,
  operationLike: Op.READ,
  primaryScope: ResourcePrimaryScope.ORGANIZATIONS,
  chartDefinition: todosByStatusChartDefinition,
},
Both registrations matter: a frontend-only chart has no registered data query to execute; a backend definition alone has no chosen screen placement. The application module must itself be installed in its layer’s module registry.
Make scope and placement explicit
The chart controller validates configured inputs, resolves trusted parent context and calls the aggregation service with the execution context and chart role configuration. For a parent-specific chart, declare the parent requirement and matching context filter; do not pass an arbitrary foreign organisation ID as a browser-selected filter.
Standard hosts can surface their configured charts. A custom host explicitly embeds the view. In this example, the custom todo read host does not automatically prepend these organisation-wide charts; the home dashboard chooses their placement. Labels, empty-state usefulness and which measures help a decision remain application design work.